By 2050, one in four people on Earth are expected to live in Africa (UN, 2024). Transport emissions on the continent are already growing almost twice as fast as in the power sector (EDGAR, 2025). The choices made today about vehicles, infrastructure and public transport will shape those emissions for decades.
Good data is not a technical nice-to-have in this context, it is a precondition for action. To design instruments that effectively promote decarbonisation, policymakers require information on the status of a country’s vehicle fleet, the activity profiles of passenger and freight traffic, and existing targets, policies and measures.
The 2026 report “Towards Decarbonising Transport” published by Agora Verkehrswende and the Deutsche Gesellschaft für Internationale Zusammenarbeit (GIZ) is one answer to that challenge: together with its interactive dashboard, it collects and publishes transport data from the original G20 member countries in detailed country profiles, with more countries to be added throughout 2026.
The interactive dashboard is available on the Agora Verkehrswende website. The full dataset can be explored and downloaded through the Transport Data Commons, an open infrastructure designed to make transport data comparable and useful for researchers, policymakers and practitioners around the world.
South Africa is the only African country among the original G20 members, giving it a unique position with a decade of comparable transport data within a global framework.
The transport sector emitted 45 Mt CO₂e in 2024, up 50 percent since 1990 (EDGAR, 2025). The sector accounts for nearly 8 percent of GDP and employs 4.5 percent of the workforce (Statistics South Africa, 2025; UNSTATS, 2023), meaning that decarbonisation is not only a climate question, but also one of jobs and livelihoods.
Road transport runs almost entirely on oil products, most of which are imported. Electricity accounts for just over one percent of transport energy consumption (IEA, 2025). Meanwhile, rail freight, which should be the lower-carbon backbone of the freight system, has been declining. Rail carried 140,000 million tonne-kilometres in 2015 and 103,868 million in 2023, a fall of around 26 percent (UIC, 2025). The country’s Freight Logistics Roadmap is directly responding to this, with a target to shift 30 percent of freight from road back to rail by 2050.
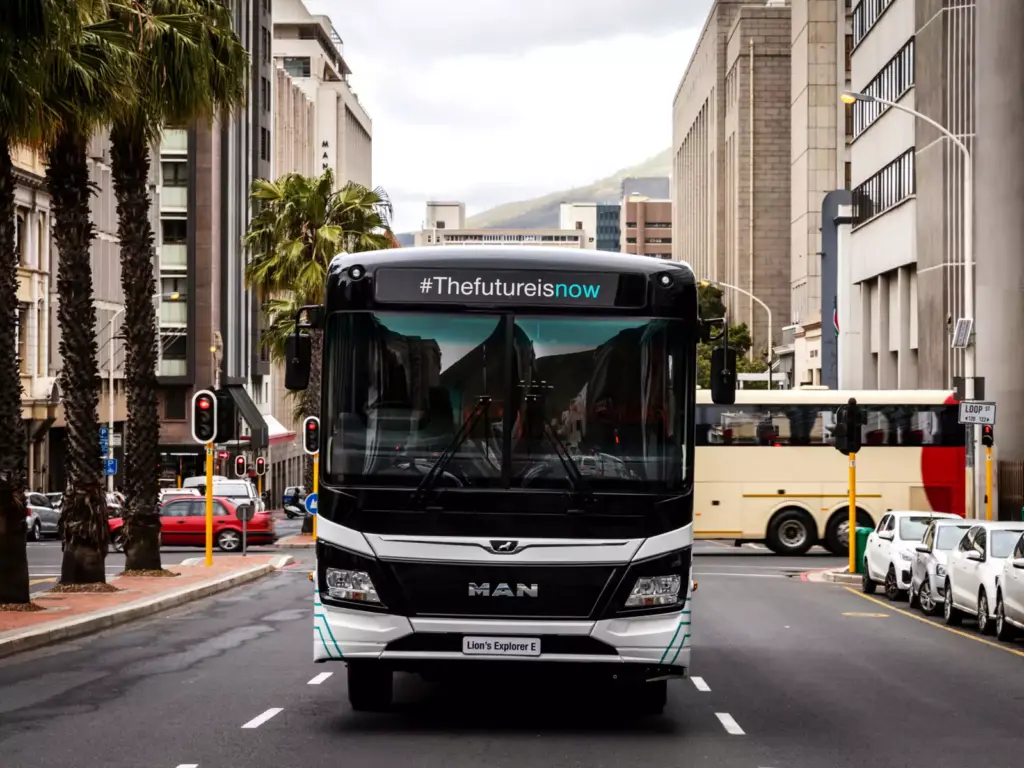
At the same time, the policy foundation is being built. A national carbon tax has been in place since 2019. Electric car sales reached 1,200 vehicles in 2024, up from virtually zero a decade ago (IEA EV Data Explorer, 2025). South Africa has the continent’s most extensive Bus Rapid Transit network, with systems in Johannesburg, Cape Town and Tshwane. Cities are also starting to electrify their bus fleets: Cape Town has already ordered electric buses for the MyCiTi line (GreenCape, 2025).
The 2024 Climate Change Act now requires every sector to define binding emission targets within one year, which could be transformative for transport if implemented ambitiously (Climate Change Act 22 of 2024).
But numbers only become meaningful in context. Open the dashboard and compare South Africa with the other G20 members.
In terms of emissions per capita, South Africa sits alongside Brazil and Argentina, with all three just below the G20 average. On EV uptake, South Africa currently ranks last in the G20, though countries at a broadly similar stage of development were at a similar level around 2021, suggesting that the market exists, but the acceleration has yet to come.
On fossil fuel subsidies, South Africa is part of the majority: 13 out of 20 G20 members increased their petroleum transport subsidies between 2015 and 2023. The countries that managed to reduce them, India, Brazil, Turkey, Argentina, China, Indonesia and Saudi Arabia, are the exception. That contrast, visible directly in the dashboard, points to one of the structural barriers the transition still needs to overcome across most of the world’s largest economies:
South Africa has set itself ambitious decarbonisation targets at the national level. This is very commendable. However, it lacks concrete policy instruments required to foster the transition needed to achieve these targets in the transport sector.
Marion Vieweg, Agora Verkehrswende, co-author of Towards Decarbonising Transport 2026
Alongside the data that exists, South Africa’s profile also highlights what is not there yet: passenger kilometres by mode, road freight volumes, and urban modal split. Many of these fields are empty and that is not a mistake.
Since 2017, South Africa has consistently reduced emissions from the transport sector, experiencing only a brief rebound after the pandemic. However, there is insufficient data available to analyse the reasons for this.
Marion Vieweg, Agora Verkehrswende, co-author of Towards Decarbonising Transport 2026
Either the data does not exist, or it is not available in a form that can be found within a reasonable timeframe. These gaps signal where investment in data infrastructure is needed, where reporting frameworks must be strengthened, and where international cooperation can make a direct difference.
These gaps exist at a continental scale. The African Union joined the G20 in 2023, but AU-wide transport data are not yet included in the dashboard. More African countries will be added throughout 2026, and each addition will make the picture more complete, helping bring Africa’s transport story into global policy conversations.
The dashboard and dataset are free and publicly available. Visit South Africa’s country profile, compare it with any G20 country available for now, and see where the data is rich and where it falls short.
And keep an eye out: more countries are coming.
The interactive dashboard was developed as part of Rethinking Transport, a GIZ self-financed initiative implemented by GIZ and Agora Verkehrswende.
The Transport Data Commons, which hosts the underlying dataset, is supported by the Mobilize Net Zero project, implemented by the Deutsche Gesellschaft für Internationale Zusammenarbeit (GIZ) GmbH and funded through the International Climate Initiative (IKI) of the German Federal Ministry for the Environment, Climate Action, Nature Conservation and Nuclear Safety (BMUKN).
MAN Lion's Explorer E electric bus in Cape Town, South Africa © MAN Truck & Bus

Belén Vásquez
maria.vasquez1@giz.de
Visit profile

Marion Vieweg
marion.vieweg@agora-verkehrswende.de