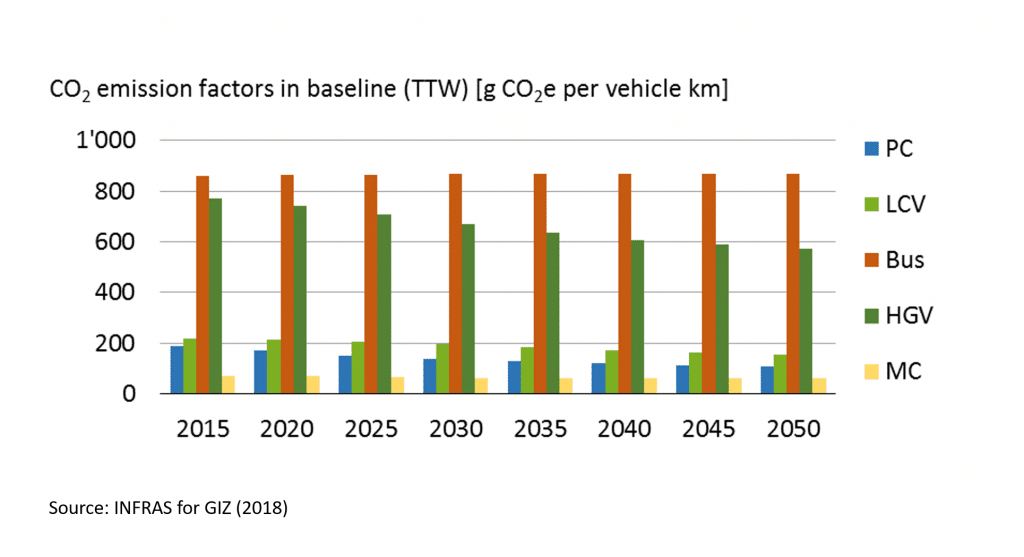
Kenya is one of the first countries in the entire region of East and Central Africa to develop country-specific road transport emission factors. While these were adapted from already existing European values, the efforts made by Kenya, through support of the Advancing Transport and Climate Strategies Project (TraCS), brings the country closer to a more accurate emission profile.
Local emission factors for road transport reflect the state of a country’s vehicle fleet and traffic situation profile. They are measured in grams of carbon dioxide equivalents (gCO2e) per vehicle-km travelled and differ depending on vehicle type and size (e.g. cars, trucks, motorcycles), as well as on the driving patterns (e.g. free flow versus stop-and-go traffic) and some additional aspects. The higher the factor, the more work needs to go towards mobility shifts and fleet improvements in the respective country. When the specific emission factors are combined with average annual vehicle kilometers travelled per vehicle category, then transport emissions can easily be assessed and further analyzed.
In the analysis carried out in Kenya, it was interesting to see how for the year 2015, while the passenger cars (Pass. Car) covered the most mileage (41%), the heavy goods vehicles (HGV) were responsible for the largest share of emissions (40% or 2.8 MtCO2 vs. 33% from passenger cars). This is due to the higher specific fuel consumption of trucks compared to passenger cars. Light Commercial Vehicles (LCV), including matatus (local minibuses) were third in line both in share of cars and share of emissions.
To achieve a level of detail in the analysis, where results are presented by vehicle types, several input data first had to be collected. These included a nationwide survey on Kenya’s vehicle fleet characteristics, driving patterns, traffic situation in the country and road conditions, conducted by the University of Nairobi. The survey captured information on mileage, age, fuel type, driving patterns and vehicle types. Additional information on the surveyed vehicles was provided by the National Transport and Safety Authority (NTSA), who holds the cumulative vehicle registration database.
The research not only gave a reflection of the characteristics of the vehicles in use, but was also the basis on which the local emission factors were developed. The results show that Kenya’s current active fleet is about 64% of all cumulative registrations (1985-2016). This means quite a substantial number have effectively retired over time.
The outputs of this analysis not only help the State Department of Transport and National Transport and Safety Authority have a clearer indication of what is on its roads, but also a much better understanding of where to focus most of GHG emission reduction efforts.
An analysis of the mitigation potentials of several measures, covering passenger and freight transport, finds that the highest potential for emission reductions in the transport sector lies in efficiency improvements of freight transport: 0.9 MtCO2e in 2030 (equivalent to an 11% reduction against the baseline) and up to around 3 Mt in 2050. The second largest potential is in electrification of road transport, including passenger cars, motorcycles and buses. Here, the size of emission reduction strongly depends on developments in the power sector and the share of renewables in the electricity mix. In the long term, decarbonisation of the national grid is a requirement to achieve significant emissions reductions.
The mitigation analysis (Greenhouse Gas Emissions From the Transport Sector: Mitigation Options for Kenya) was supported by INFRAS.
Moving forward, building a robust data-sharing platform between different government agencies is essential. This will mean putting more focus towards the establishment of a robust data storage and back-up system, as well as enhancing the data collection process. The National Transport and Safety Authority, for instance, has already expressed willingness to include odometer readings in their future vehicle inspections, which will eventually provide access to annual mileage data.

Herman Kwoba