The NDC Transport Tracker allows you to explore and compare national ambitions, targets and policies in Nationally Determined Contributions (NDCs) and Long-Term Low GHG Emission Development Strategies (LTS). Learn more about the development of the tracker here.
If you’d like to download the full Excel dataset, click here.
In this how-to-use guide, the different elements of the NDC Transport Tracker will be explained. We will soon share a video that explains the same. If you are interested in analysis approaches for the information provided by the tracker, consult our summary analysis. You can further learn about the key insights and good practices that result from the analysis here.
Quick step-by-step instruction
Click on World map to get a full overview of all available filtering options. Alternatively, click on Targets, Mitigation and adaptation measures or Process and benefits to only see the applicable filters.
Limit your search by clicking on the appropriate filters.
Click on “Show results” to be redirected to the display of results.
You can switch between different modes of display by using the tabs at the top of the tracker or click on a country or indicator to explore more.
Use “Export results” to download a csv-file of your selected results.
If you want to start a new search, don’t forget to clear previously selected filters. You can use the “Clear all”-option to reset your selection for every filter option.
Elements of the Tracker
The tracker consists of three main parts that you can use to customize the results and find what you are looking for:
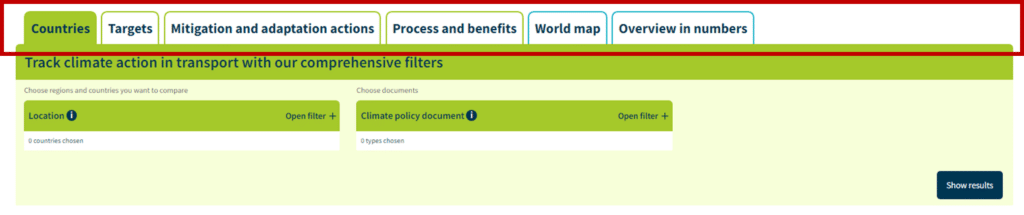
Modes of display: At the top of the tracker you find six tabs that show different types of information in three different ways (world map, tables, bar charts)
Filters: the green-grey area offers filter options
Results: The display of results at the bottom of the tracker
If you are unsure about the terminology used in the tracker, you can consult the glossary for clarification. The blue and white information symbol next to some features also provides you with explanations. You can see them if you trace over them with your mouse.
Modes of Display
You can choose between six modes of display by clicking on the respective tab at the top of the tracker. The results will become visible immediately at the bottom of the tracker.
The world map shows all countries colored in one of four colors, depending on their latest NDC. If you trace the mouse along the map, the name of the country will appear accordingly. Click on a country to be redirected to the country page which provides additional information and an overview of all climate policies of that particular country. The world map reacts to the applied filters.
Countries shows a table sorted by country. It gives a quick overview about the references a country’s climate policy makes to transport. There are different types of references registered, e.g. mitigation or adaptation measures included in the climate documents, reference to governance tools, investment needs and so on. For each country and climate policy document, the table lists the types of transport references. Click on the references that are marked blue to see more. Also, the table shows the UNFCCC member party type of each country, i.e. if it is an annex-1 country or a non-annex 1 country. For more information on the UNFCCC party categorization see here.
The Targets table gives information about the types of targets that are included in the documents. The results are presented as a chart with a row for every target and additional information on the target type and the target year. If you click on the name of a country, you will be redirected to the country overview page.
The Mitigation and adaptation measures table shows the climate actions that are included in the climate policy documents. The attributes column provides additional information on the geographical scope, the transport mode and the activity type targeted with the action. You can find all countries that have included a specific climate action in the column on the right. Click on their name to go to the country page.
If you choose Overview in numbers, you will find bar charts indicating the share of all considered documents for mitigation and adaptation measures as well as targets. The bar charts provide a graphic illustration of the number of climate policy documents that make reference to climate actions or targets related to transport. By clicking on the + Symbol next to each category, a more detailed display of results will be presented. You can either choose to look at the absolute numbers for one type of climate policy document or you compare two documents. When comparing numbers for two types of document, please keep in mind that the bar charts always show absolute numbers. You can break down the results by income, party type or member status of the OECD of a country.
Filter options
Below the modes of display, you find a box with several filter options to customize your search. The available filter options depend on the mode of display. You can open or close the different filters as you wish.
In the green-grey filter box, you can choose between filtering options by
Location: Choose individual countries or select countries by geographical region, socioeconomic classification or supranational membership.
Climate policy document: Choose one or several climate policy documents to see what references they make to transport. For more information on the different types of documents mouse over the blue round button.
Mitigation and adaptation measure: We defined close to 100 transport mitigation measures. To make the search easier for you, we grouped them. You can either choose between those groups and thereby see which countries mention certain types of transport mitigation. Or you look for modes of transport, e.g. when you are interested to see what types of active mobility are reflected in the documents. Alternatively, you can filter for references that are specific to urban or rural transport. Moreover, you can look for measures that specifically address freight or passenger transport. Also, it is possible to filter according to the Avoid-Shift-Improve (ASI) framework.
Process and Benefits: Here you can look for references related to governance tools for transport, means of implementation mentioned in the climate policy documents, benefits of mitigation and adaptation in transport that go beyond emissions reduction and have been emphasized in the documents and investment allocation and financing needs.
Climate targets: We recorded sector wide GHG emission reduction targets but, of course, we also looked for transport specific targets, both for mitigation of GHG gases as well for adaptation to climate change as well as references to long-term visions for the sector.
You can use “Open filter +” and “Close filter x” to open or close the filtering options.
Depending on the type of filter you can select a predefined category by clicking on it. The option will turn to a dark blue color to indicate your selection. You can easily deselect the option by clicking on it again or use “clear all” to undo your selection in this category. Some filter options provide you with a drop-down menu that you can use to select the appropriate filter. You can either scroll down and click on the options you want to include or simply type in the name of the respective indicator if you already know what you are looking for.
The overview in numbers works a little differently. The bar charts that you’ll see when you click on said overview provide a graphic illustration of the number of climate policy documents that make reference toclimate actions or targets related to transport. Hence, your filtering options will be adjusted to the new mode of display:
You can choose between a focus on mitigation, adaptation or targets by using the three boxes on the top of the filter options. You can further decide on a type of policy document or compare types of documents. Use the breakdown options to break down the displayed bar according to the option you choose. The income classification, for example, will show you how many high-income, middle-income and low-income countries include information on the category that you look at (e.g. how many low-income countries include references to electric mobility in comparison to middle- and high-income countries).
Display of results
At the bottom of the tracker, the results of your search will be displayed according to the mode of display and the filters you selected. You can either see the results of your selection on the world map or as a table.
The results of the Overview in numbers appear right below the selection pane.
All results can be downloaded as a csv-file. For more information on how to convert a csv-file into an Excel file click here.
If you’d like to download the full dataset, click here.